(10min demo at the performance.now() meetup, 20 November 2019, Amsterdam)
CrUX is the Chrome User Experience Report, a public dataset of performance and UX data from real Chrome users in the field.
Quick facts:
- Launched in November 2017
- Monthly data dumps (second Tuesday)
- 15,345,058 origins published since launch
- ~6M distinct origins per month
Quick links:
- Official documentation
- Walkthroughs on web.dev
- CrUX Dashboard
- CrUX Cookbook
- @ChromeUXReport
- Google Group
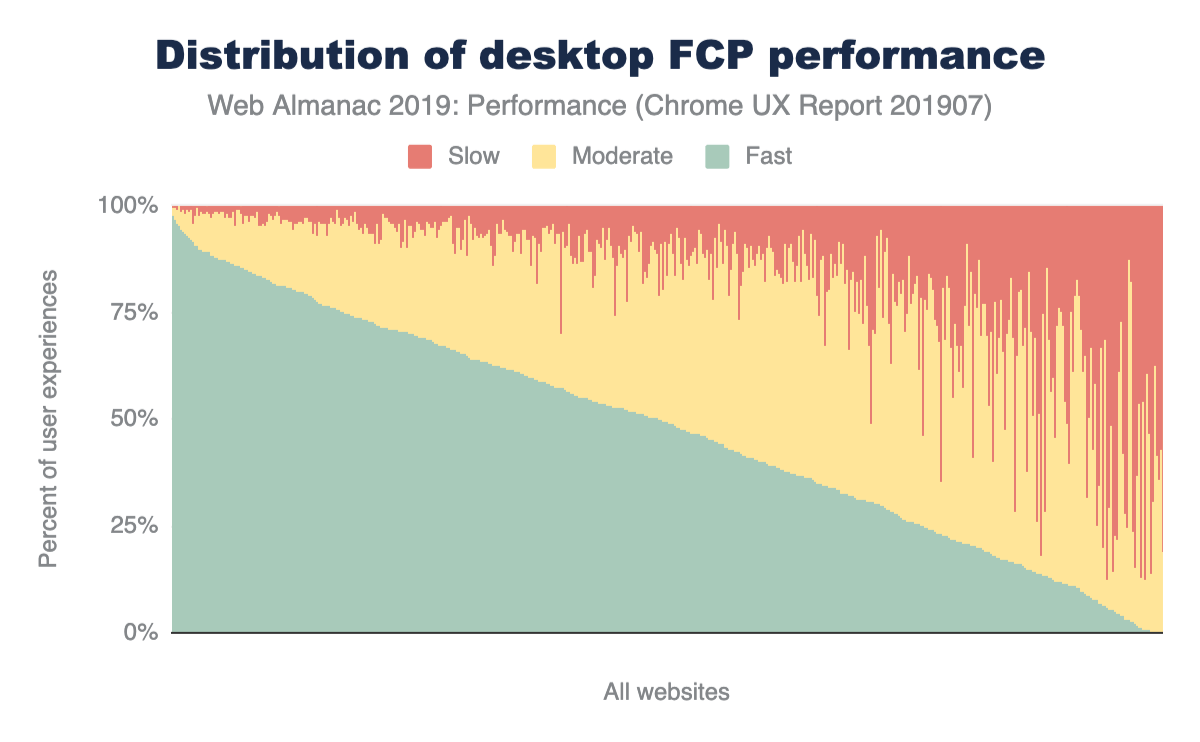
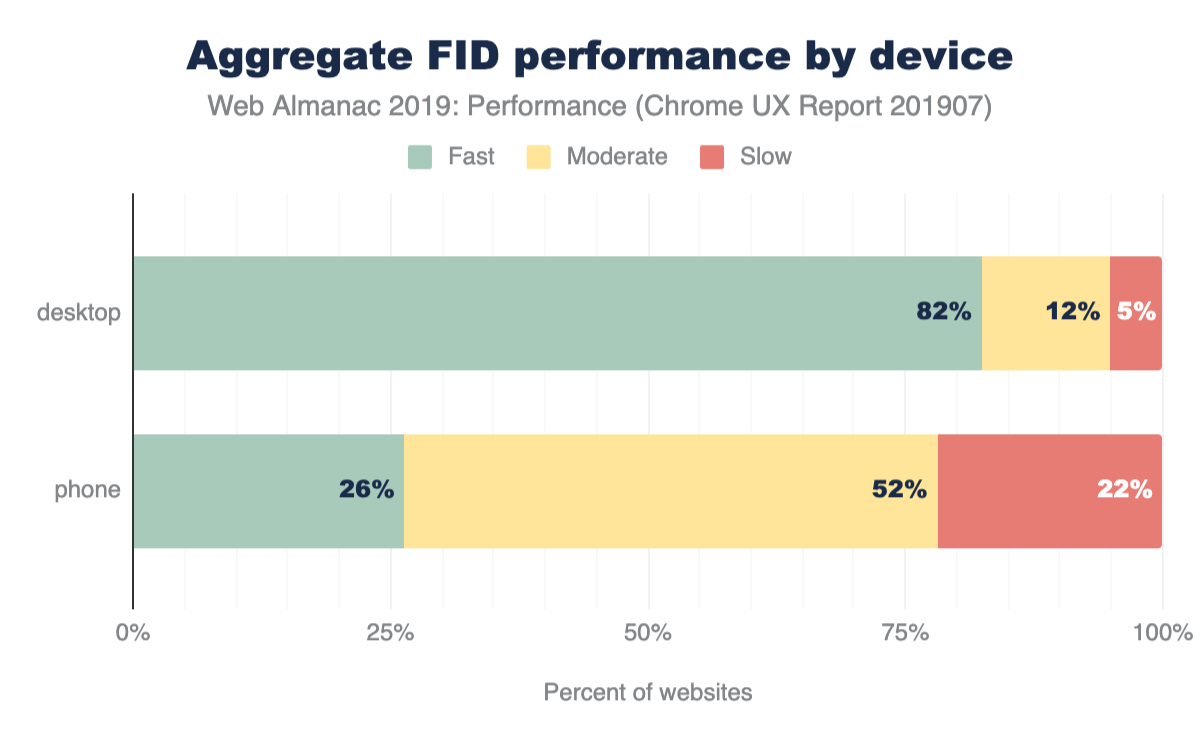
Using CrUX data from the field, I wrote the Performance chapter of the brand new Web Almanac. I look at FCP, TTFB, and FID experiences across all ~6M websites to try to understand how users are experiencing the web.
- FCP and FID fast/moderate/slow per URL
- URL clustering
What does CrUX have to do with Search Console? Speed is a ranking factor for mobile searches. SC is a webmaster tool for understanding how to succeed with Search.
"there is no tool that directly indicates whether a page is affected by this new ranking factor"
-
Time to First Byte (TTFB) powers the ismyhostfastyet.com leaderboard of host performance.
-
Largest Contentful Paint (LCP) is a new metric to the web platform that helps developers to understand how users visually perceive page loads by reporting the time until the largest element is rendered.
-
Cumulative Layout Shift (CLS) leverages the Layout Stability API to quantify if a web page has a "jank" problem.
- historical trends
- per-origin
PSI:
- trailing 30-days
- origin and URL
- API
PSI is "use it or lose it". So, let's use it with a Sheets script. See it in action.
We have lots of nice tools, but the CrUX dataset on BigQuery is still a treasure trove of insights.
- country datasets
- high-resolution histograms
- experimental metrics (LCP, CLS, FID, etc)
- ECT and form factor (desktop/phone/tablet) dimensions
Don't be afraid to roll up your sleeves, write some SQL, and mine the dataset. We've got some sample queries to get you started in the Cookbook.

